
source: http://www.scmp.com/news/hong-kong/article/1227888/pet-park-plans-centre-homeless-row
|
Wealth Disparity
|
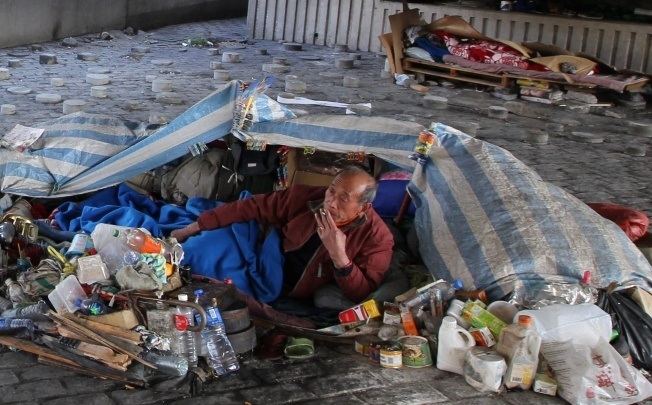
We have spent the time looking at the types of housing in Hong Kong. Now we're going to focus on the people who live in them. These people really have no choice about where they live. Why? What can be done?
- Poverty is when a person actually is or feels himself to be short of the things that are essential for living.
- Wealth is when a person has a vast surplus of things essential for life and has money tied up in extra possessions such as fine pictures or valuable jewels.
- Wealth Disparity is the inequality or unequal distribution or sharing of wealth within a society
- Primary poverty or absolute poverty is when a person does not have enough food to eat, or shelter or any of the things that are absolutely essential for life.
- Secondary poverty or relative poverty is when a person does not have the things that a society considers important for decent life.
Human Wealth Distribution Graph
|
Working population by Monthly income (in HK dollars) from main employment 2011
HK$ <4,000 HK$ 4,000-8,000 HK$ 8,000-10,000 HK$ 10,000-15,000 HK$ 15,000-20,000 HK$ 20,000-25,000 HK$ 25,000-30,000 HK$ 30,000-40,000 HK$ 40,000-60,000 HK$ >60,000 |
# of students (each student represents 4% of population) 3 4 4 7 3 2 1 2 1 1 |
| overview_of_housing_problems.pdf |
Wealth Disparity in Hong Kong videos |
|
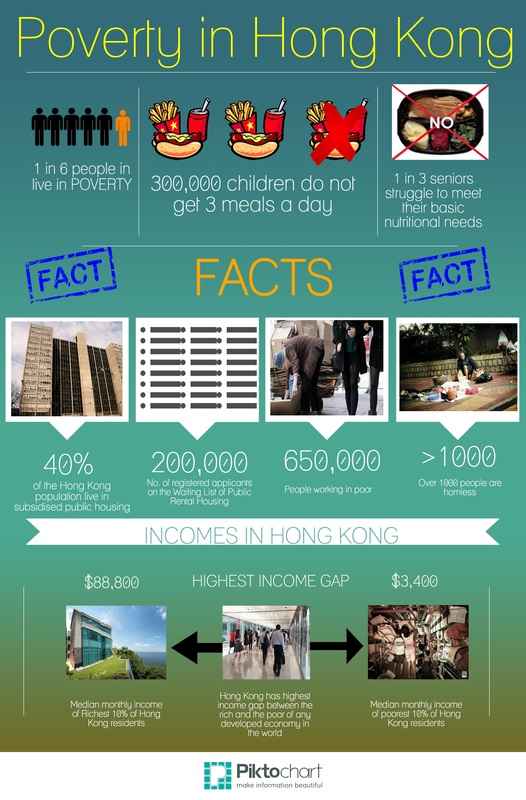
Poverty Info graphic
Use the statistics to create an infographic about Hong Kong poverty and wealth disparity. Use the following facts to create your infographic.
Use the statistics to create an infographic about Hong Kong poverty and wealth disparity. Use the following facts to create your infographic.
- 1 in 6 people in live in poverty
- 970,000 people live under the poverty line
- The poverty line for a one-person family is HK $3,800 per month
- 40% of the Hong Kong population live in subsidised public housing
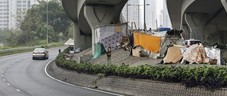
- 200,000+ people live in coffin, cage homes and rooftops
- Over 1,600 people are homeless
- Hong Kong has highest income gap between the rich and the poor of any developed economy in the world
- The minimum wage, introduced in 2018, is HK$34.50 per hour
- There are 650,000 working poor
- 300,000 children do not get 3 meals a day
- 1 in 3 seniors struggle to meet their basic nutritional needs
- 1 in 3 people from Hong Kong's ethnic minorities lives in poverty
- No. of registered applicants on the Waiting List of Public Rental Housing: 300,000
- Median monthly income of poorest 10% of Hong Kong residents: $2,560 in 2017
- Median monthly income of Richest 10% of Hong Kong residents: $112,450 in 2017
The above link is a brutally honest look at the life of people in Hong Kong who live in poverty.
Now we're going to learn a new skill.
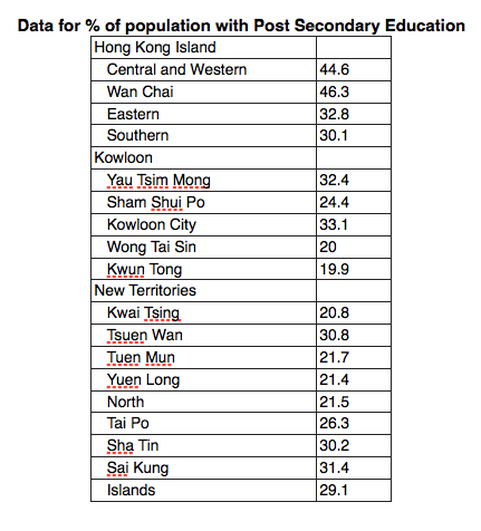
How to make a choropleth map. Use the following information about education levels in Hong Kong and income, create two choropleth maps and try to find a relationship between income and education.
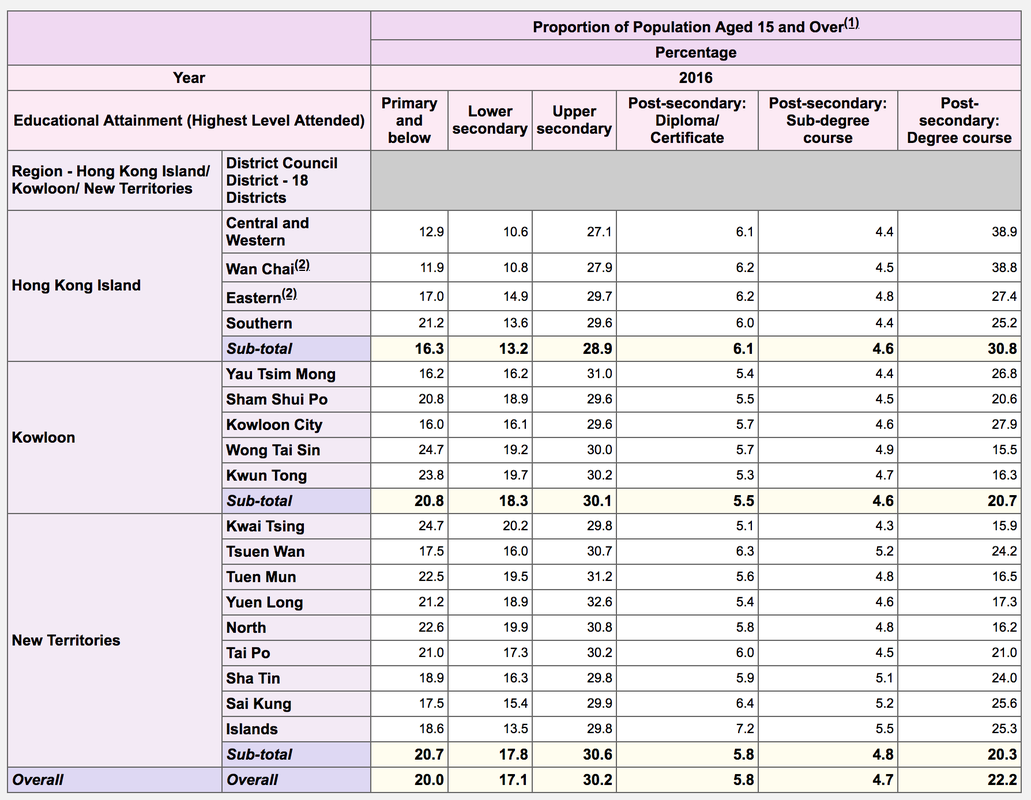
Income disparity is often related to the education levels of each district, city, region or country. When comparing education, we can use Post Secondary / Tertiary Education (專上教育) as an indicator (指針) of education levels. Create a choropleth map of the percentage of people with Post Secondary education in each district.
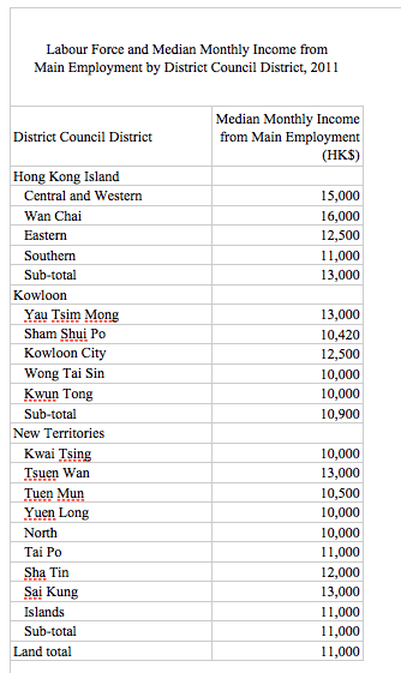
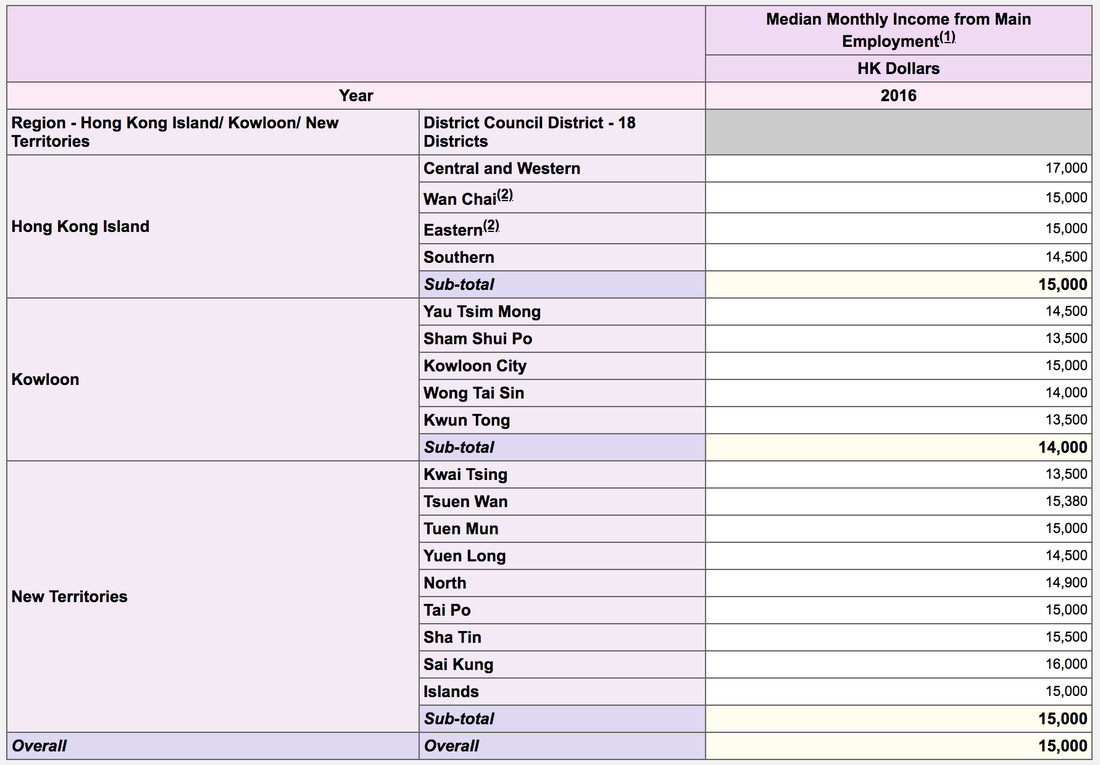
Median income is the final map that you are going to create. Median income is the average income for each of the working age people living in a district, city, region or country. It is often related to the level of education that you hold and the industry that you work in. Below, you will see the data for the map you will create on median income.
Click below for the file to use for uploading to Sumopaint
How to make a choropleth map. Use the following information about education levels in Hong Kong and income, create two choropleth maps and try to find a relationship between income and education.
Income disparity is often related to the education levels of each district, city, region or country. When comparing education, we can use Post Secondary / Tertiary Education (專上教育) as an indicator (指針) of education levels. Create a choropleth map of the percentage of people with Post Secondary education in each district.
Median income is the final map that you are going to create. Median income is the average income for each of the working age people living in a district, city, region or country. It is often related to the level of education that you hold and the industry that you work in. Below, you will see the data for the map you will create on median income.
Click below for the file to use for uploading to Sumopaint
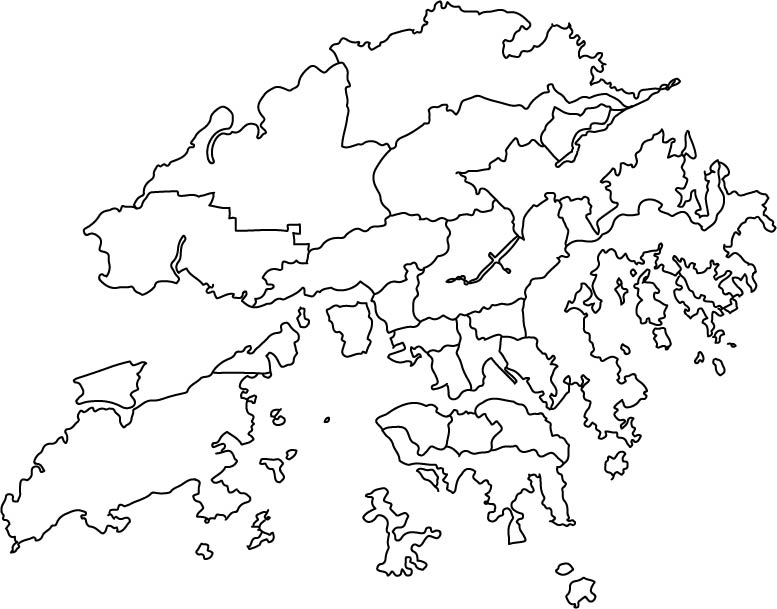
| hong_kong_district_map.jpg |

Use SUMOPAINT www.sumopaint.com/app/ to create a choropleth map.
Here is the information required to make the maps for both education and income.
Here is the information required to make the maps for both education and income.
|
|
Source: https://www.censtatd.gov.hk/hkstat/sub/so459.jsp
Describe the maps that you have just created using some of the terms below.
If you aren’t sure of the word, look it up.
Try to look for and describe general patterns to describe it. What does it look like? Is there a pattern?
Is there a relation between income and education?
ex. Do districts with higher monthly median income, have a higher % of tertiary education?
If you aren’t sure of the word, look it up.
Try to look for and describe general patterns to describe it. What does it look like? Is there a pattern?
- evenly distributed 均勻分佈
- unevenly distributed 分佈不均
- dispersed 疏散
- clustered 集群
- random 隨機
- regular 固定
- scattered 疏散
- concentrated 集中
- nucleated 核
Is there a relation between income and education?
ex. Do districts with higher monthly median income, have a higher % of tertiary education?
