
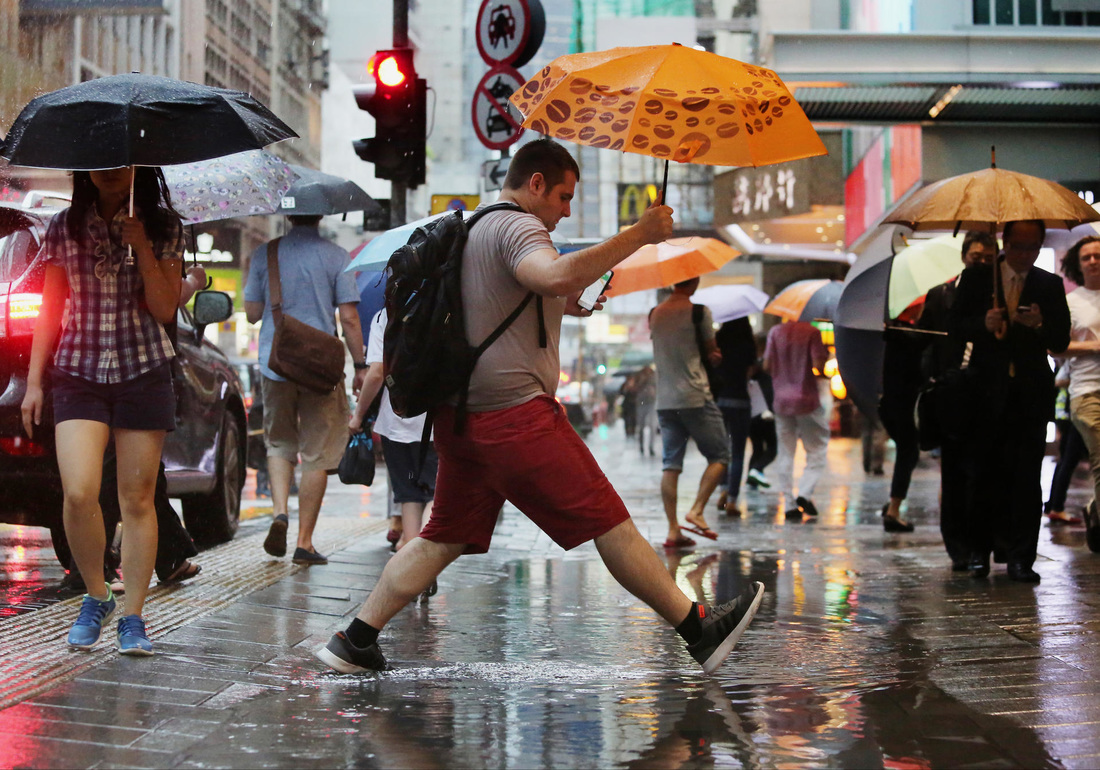
source: http://www.scmp.com/.../red-rainstorm-signal-hoisted-third-time-week-hong
|
Weather vs. ClimateWhat is the difference between weather and climate?
Search for a definition for each and write a short paragraph that highlights the difference between weather and climate. Draw a table in your book with two columns. One column should be called “climate” the other should be called “weather” write down the following statements in one of the two columns (whichever is the most appropriate)
|
Interactive Map of Climate Graphs1. Do the bars show the temperature or the precipitation?
2. What color do the bars need to be? 3. What color does the line need to be? 4. Which city is the driest? 5. Which city is the wettest? 6. Name 2 cities that are hotter in December than August? 7. Name 2 cities that are hotter in August than December? 8. Which city is the coldest? Interesting extremes Locally: Hottest, Wettest, Driest |

|
Constructing climate graph
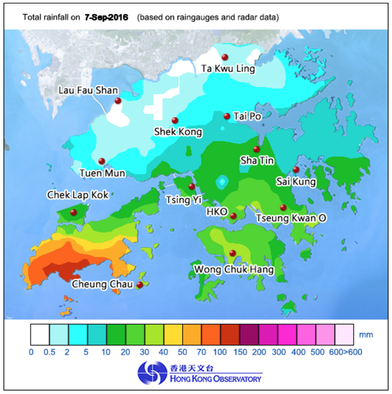
Go to http://www.hko.gov.hk/contente.htm
Climate graphs are constructed using data collected by meteorologists.
To construct a climate graph, use the climate graph template and follow the steps below.
1. Select a data source. You can find climate data on the world climate websites mentioned on the previous page.
2. Transfer the temperature and rainfall data from your data source into the table at the base of the climate graph.
3. Locate the wettest month and the months with the highest and lowest temperatures. Use this information to add a suitable scale for both temperature and precipitation (rainfall). Place temperature scale on the graph's left-hand axis and rainfall on the right-hand axis.
4. Plot the rainfall figures. Then colour the columns blue.
5. Plot the average maximum and minimum temperature data, making sure each dot is placed in the centre of the month. Use a red pen or pencil to join the points plotted for the average maximum temperature with a smooth, red curve. Use blue for the line joining the points marking the lowest monthly temperature.
6. Add a heading that includes the name of the place being graphed and its latitude, longitude and elevation.
- Click on the button that says "Climate"
- Then click on "Climate information services"
- Next go to "Monthly normals"
- Focus on "Mean Monthly Rainfall" (table 2) and "Mean Monthly Temperature" (table 4)
Climate graphs are constructed using data collected by meteorologists.
To construct a climate graph, use the climate graph template and follow the steps below.
1. Select a data source. You can find climate data on the world climate websites mentioned on the previous page.
2. Transfer the temperature and rainfall data from your data source into the table at the base of the climate graph.
3. Locate the wettest month and the months with the highest and lowest temperatures. Use this information to add a suitable scale for both temperature and precipitation (rainfall). Place temperature scale on the graph's left-hand axis and rainfall on the right-hand axis.
4. Plot the rainfall figures. Then colour the columns blue.
5. Plot the average maximum and minimum temperature data, making sure each dot is placed in the centre of the month. Use a red pen or pencil to join the points plotted for the average maximum temperature with a smooth, red curve. Use blue for the line joining the points marking the lowest monthly temperature.
6. Add a heading that includes the name of the place being graphed and its latitude, longitude and elevation.
|
Task: Create your own Hong Kong climate graph You are going to draw your own climate graph for Hong Kong using the data in the table. Your graph should show only precipitation (coloured blue) and average maximum temperature (coloured red). Use only half a page of your graph paper because you will be drawing a second graph later. Don’t forget to use a ruler, shade neatly and add; a title, axes labels, unit measures. Extension Task: Create your own (travel destination city) climate graph Now search for another city of your choice, it can be anywhere in the world. Find the data and draw a climate graph for this city on the same sheet as your graph for Hong Kong. Write a paragraph to compare the climate in these two locations. Add in comments on the differences in high and low temperatures, when the wet and dry seasons are in each location. Which location has the highest/lowest temperatures. Etc. Try to add as much detail as possible to compare. Finding climate data The websites of the following organisations can be used to locate climate data for a city of your choice.
|
|
| monsoons__climate_graphs.pdf |
|
|
|
